|
||||
Select period to view: 1 Day 3 Days 1 Week 2 Weeks 1 Month or Back to Summary Page |
||||
| Monthly Highs/Lows | History Graphs for , | |||
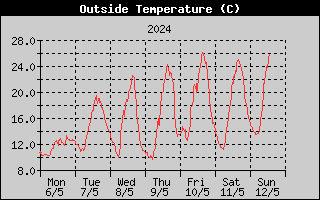
| High Temperature Low Temperature |
19.1
°C
3.4 °C |
|
||
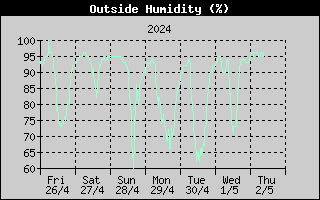
| High Humidity Low Humidity |
100
%
63 % |
|||
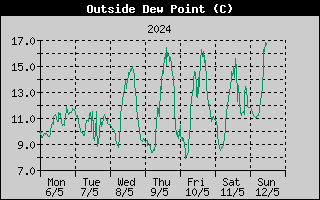
| High Dewpoint Low Dewpoint |
16.7
°C
2.2 °C |
|||
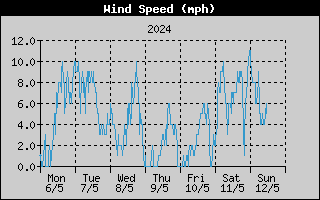
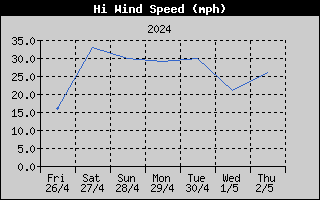
| High Wind Speed | 57.0 mph | |||
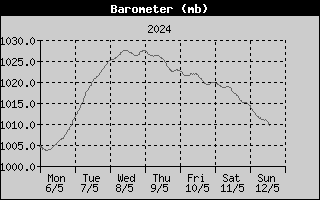
| High Barometer Low Barometer |
1033.1
mb
973.4 mb |
|||
| Rain Total | 6.9 mm | |||
| High Rain Rate | 0.3 mm/hr | |||
| Low Wind Chill | 0.0 °C | |||
| High Heat Index | 19.4 °C | |||
| Yearly Highs/Lows | ||||
| High Temperature Low Temperature |
31.3
°C
-1.9 °C |
|||
| High Humidity Low Humidity |
100
%
27 % |
|||
| High Dewpoint Low Dewpoint |
22.2
°C
-6.1 °C |
|||
| High Wind Speed | 144.0 mph | |||
| High Barometer Low Barometer |
1041.0
mb
970.4 mb |
|||
| Rain Total | 379.0 mm | |||
| High Rain Rate | 49.3 mm/hr | |||
| High Heat Index | 35.0 °C | |||
| Low Wind Chill | -6.1 °C | |||
Back to Summary Page
|
||||